
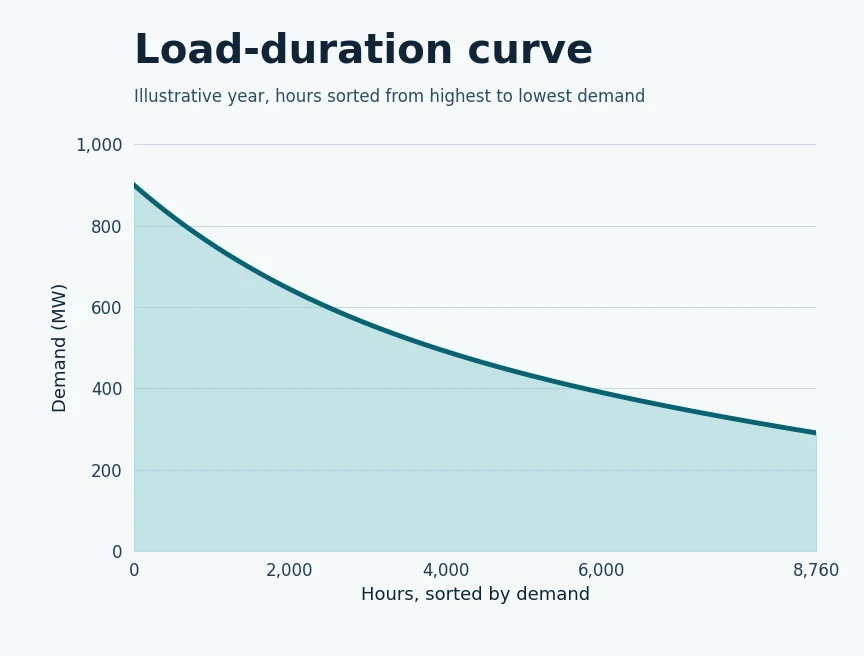
A normal demand chart puts the hours in time order. A load-duration curve sorts those same hours from highest demand to lowest. The left side shows the largest demands. Farther right you can see how long the system needed lower levels of power.
What does sorting buy you?
A utility can see whether a high load happened only a few times or stayed around for much of the year. That can help it compare equipment that’s useful for a brief peak with resources that need to run more often.
What does the chart leave out?
It loses the order of the hours. Two systems can have similar curves even if one peaks in the morning and another peaks in the evening. For jobs that depend on timing, like charging storage, the original sequence still matters.
For more on how utilities plan for changes in electricity demand, see Basics of Electric Utilities 101.